


Chart Inaccuracies – Understanding the Limits of Paper Charts and ENCs
Captain's Corner Magazine · 17 October 2026
Your GNSS position may be accurate to a few metres — but the shoal on the chart may come from a survey a century old. How survey age, chart compilation and CATZOC shape what you can trust.
Modern navigation charts can appear extremely precise, particularly when viewed on an ECDIS or chartplotter. However, a chart is only as reliable as the hydrographic surveys and other source information from which it was compiled. A vessel's GNSS-derived position may be accurate to a few metres, while the coastline, shoal or wreck displayed on the chart may originate from surveys conducted decades—or even more than a century—ago.
Survey Accuracy
One of the greatest influences on chart reliability is the method, coverage and age of the underlying hydrographic survey. Older surveys were commonly carried out using lead lines, sextant fixes and widely spaced sounding lines. These techniques provided useful information, but substantial areas of seabed between the lines may not have been examined. A rock, pinnacle or wreck could therefore have remained undetected. The absence of a charted danger is not necessarily evidence that the area was systematically searched.
Modern surveys use technologies such as multibeam echo sounders, side-scan sonar, GNSS positioning and motion sensors. These can provide substantially improved positional and depth information and, where appropriately designed and executed, more complete seabed coverage. Nevertheless, the quality of the resulting data depends on the survey specification, line planning, equipment performance, positioning, motion compensation, sound-speed control, processing, feature detection, quality control and the standards applied. Multibeam coverage alone does not automatically establish that every navigationally significant feature has been detected or that all depths have the same accuracy.
The IHO emphasizes that the accuracy and reliability of depth information in ENCs can vary considerably according to the age and nature of the source survey, the technology used, the extent of seabed search and the compilation process. (https://iho.int/en/new-guide-on-accuracy-of-depth-information-in-electronic-navigational-charts-encs)
Chart Compilation
Survey accuracy is only part of the issue. Charts are compiled products, often combining information from numerous surveys conducted at different times, using different equipment, datums and standards.
During compilation, hydrographic offices may need to transform older positions to a modern horizontal datum such as WGS 84, account for the source datum and transformation uncertainty, select representative soundings and generalize information to suit the intended chart scale. Vertical datums, including the chart datum used for depths and drying heights, must also be considered. The resulting charted information may therefore contain different levels and types of uncertainty within the same chart or ENC cell.
Consequently, neighbouring features on the same chart may have substantially different source quality and positional or depth accuracy. This is particularly important when viewing data at a scale larger than the compilation scale. Electronic charts can be zoomed in beyond the compilation scale, but zooming does not improve the accuracy, resolution or completeness of the underlying source data. A precisely drawn electronic symbol should therefore not automatically be interpreted as a precisely surveyed position.
Paper Charts – Source and Confidence Information
Traditionally, navigators assessed the reliability of a paper chart using its Source Diagram or similar source information. This may identify where and when surveys were conducted and may indicate the surveying technique, source datum, compilation scale and other relevant limitations. The precise content and presentation vary between hydrographic offices and chart series.
A navigator approaching shallow water should therefore consider not only the charted depth, but also the quality, coverage and limitations of the survey or other source information from which that depth was compiled. The UK Hydrographic Office notes that mariners traditionally used Source Diagrams to assess the confidence they could place in charted information. (https://www.admiralty.co.uk/news/CATZOC-dispelling-the-myths)
ENC and CATZOC
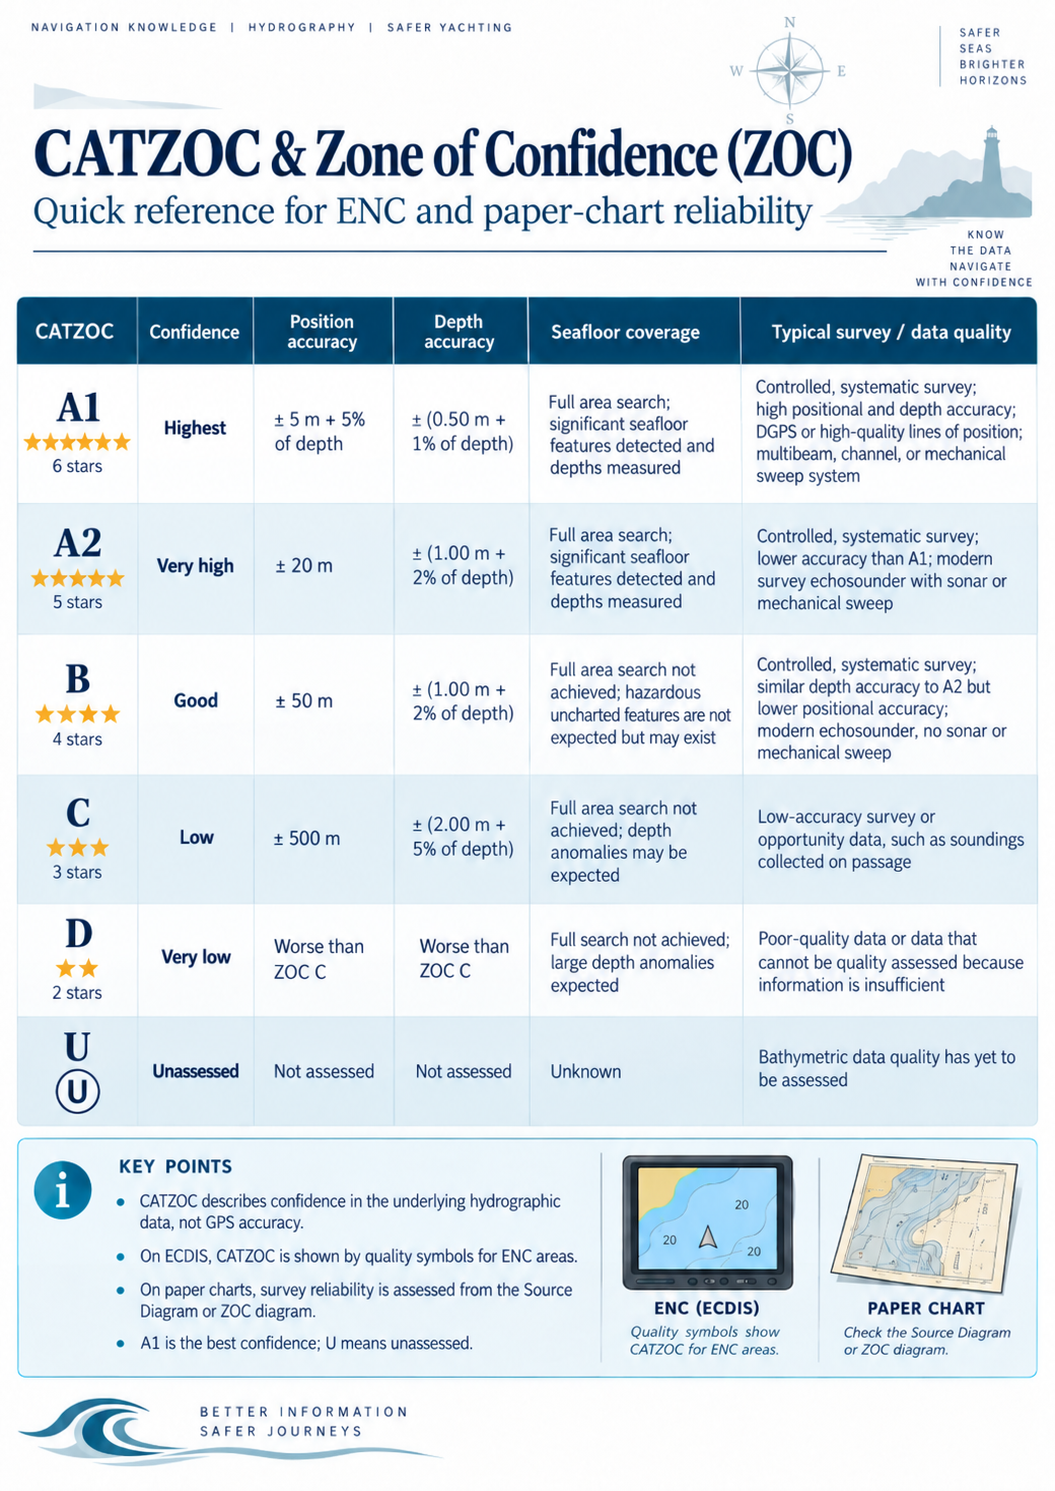
Electronic Navigational Charts may provide an indication of source-data quality through the Category of Zone of Confidence in Data, or CATZOC. CATZOC is encoded in the quality-of-data information associated with an ENC and is intended to communicate the assessed quality of the underlying hydrographic data for a defined area. The commonly used categories are: A1 – A2 – B – C – D – U.
A1 represents the highest category, followed by A2, B, C and D. U indicates that the data quality has not been assessed. The categories are based on specified criteria relating principally to position accuracy, depth accuracy and the adequacy of seabed search or feature detection. They describe the assessed quality of source data for a zone; they are not a guarantee that every individual feature or sounding within that zone meets identical limits.
CATZOC does not describe GNSS accuracy, ECDIS display accuracy or the accuracy of the vessel's own position. Nor does it necessarily provide a complete statement of the uncertainty of every charted feature. It is an indication of the quality of the hydrographic information used in compiling that part of the ENC, subject to the applicable IHO specifications and the information supplied by the producing authority. The IHO describes the Zone of Confidence system as a means of communicating varying levels of confidence in positional and depth information, together with the adequacy of seabed search, to the mariner. (https://iho.int/en/new-guide-on-accuracy-of-depth-information-in-electronic-navigational-charts-encs)
On ECDIS, CATZOC information can be displayed to help the navigator assess the reliability of charted depths and hazards in relation to the vessel's draught, route and required under-keel clearance. CATZOC is an aid to risk assessment, not a substitute for the charted depth, navigational warnings, survey notes, applicable sailing directions, or prudent navigation. It should also not be treated as a complete measure of navigational risk, since hazards may arise from factors such as seabed mobility, chart age, uncharted features, environmental conditions and limitations in the compilation.
The Navigator's Safety Margin
The fundamental lesson is simple: Position accuracy and chart accuracy are not the same thing. A GNSS receiver may indicate the vessel's position with metre-level accuracy, while the nearby charted obstruction may have substantially greater positional uncertainty. In addition, the charted depth may have uncertainty that is independent of the vessel's horizontal position. When navigating close to shoals, reefs, wrecks or poorly surveyed coastlines, prudent navigation should therefore consider: the age, method, coverage and specification of the hydrographic survey; the chart's Source Diagram or other source information; the ENC CATZOC classification and any associated quality-of-data information; the scale and compilation history of the chart or ENC cell; horizontal, vertical and depth uncertainty; the vessel's draught, squat, tidal conditions and required under-keel clearance; and independent information from echo sounders, radar, visual observations, sailing directions, navigational warnings and other available sensors.
Electronic navigation has greatly improved situational awareness, but it has not eliminated the uncertainties contained in the original hydrographic data or in subsequent chart compilation. The safest navigator therefore does not ask only, "Where does the chart show the danger?" but also, "How accurately do we know where that danger is, and how reliably has the area been surveyed?"
The IHO S-57 standard remains the basis for the production and exchange of many existing ENC datasets. S-101 is the newer IHO ENC Product Specification intended to supersede S-57 for future-generation ENCs as implementation, validation and distribution arrangements progress. S-101 is not simply a display upgrade; it introduces a new product specification and data model within the broader S-100 framework. During the transition, S-57 and S-101 products may coexist, subject to the relevant carriage, equipment and service arrangements. IHO guidance encourages mariners to understand the quality and limitations of the hydrographic information behind the electronic display. (https://iho.int/en/enc-production-s-57)
More in Knowledge
 Knowledge
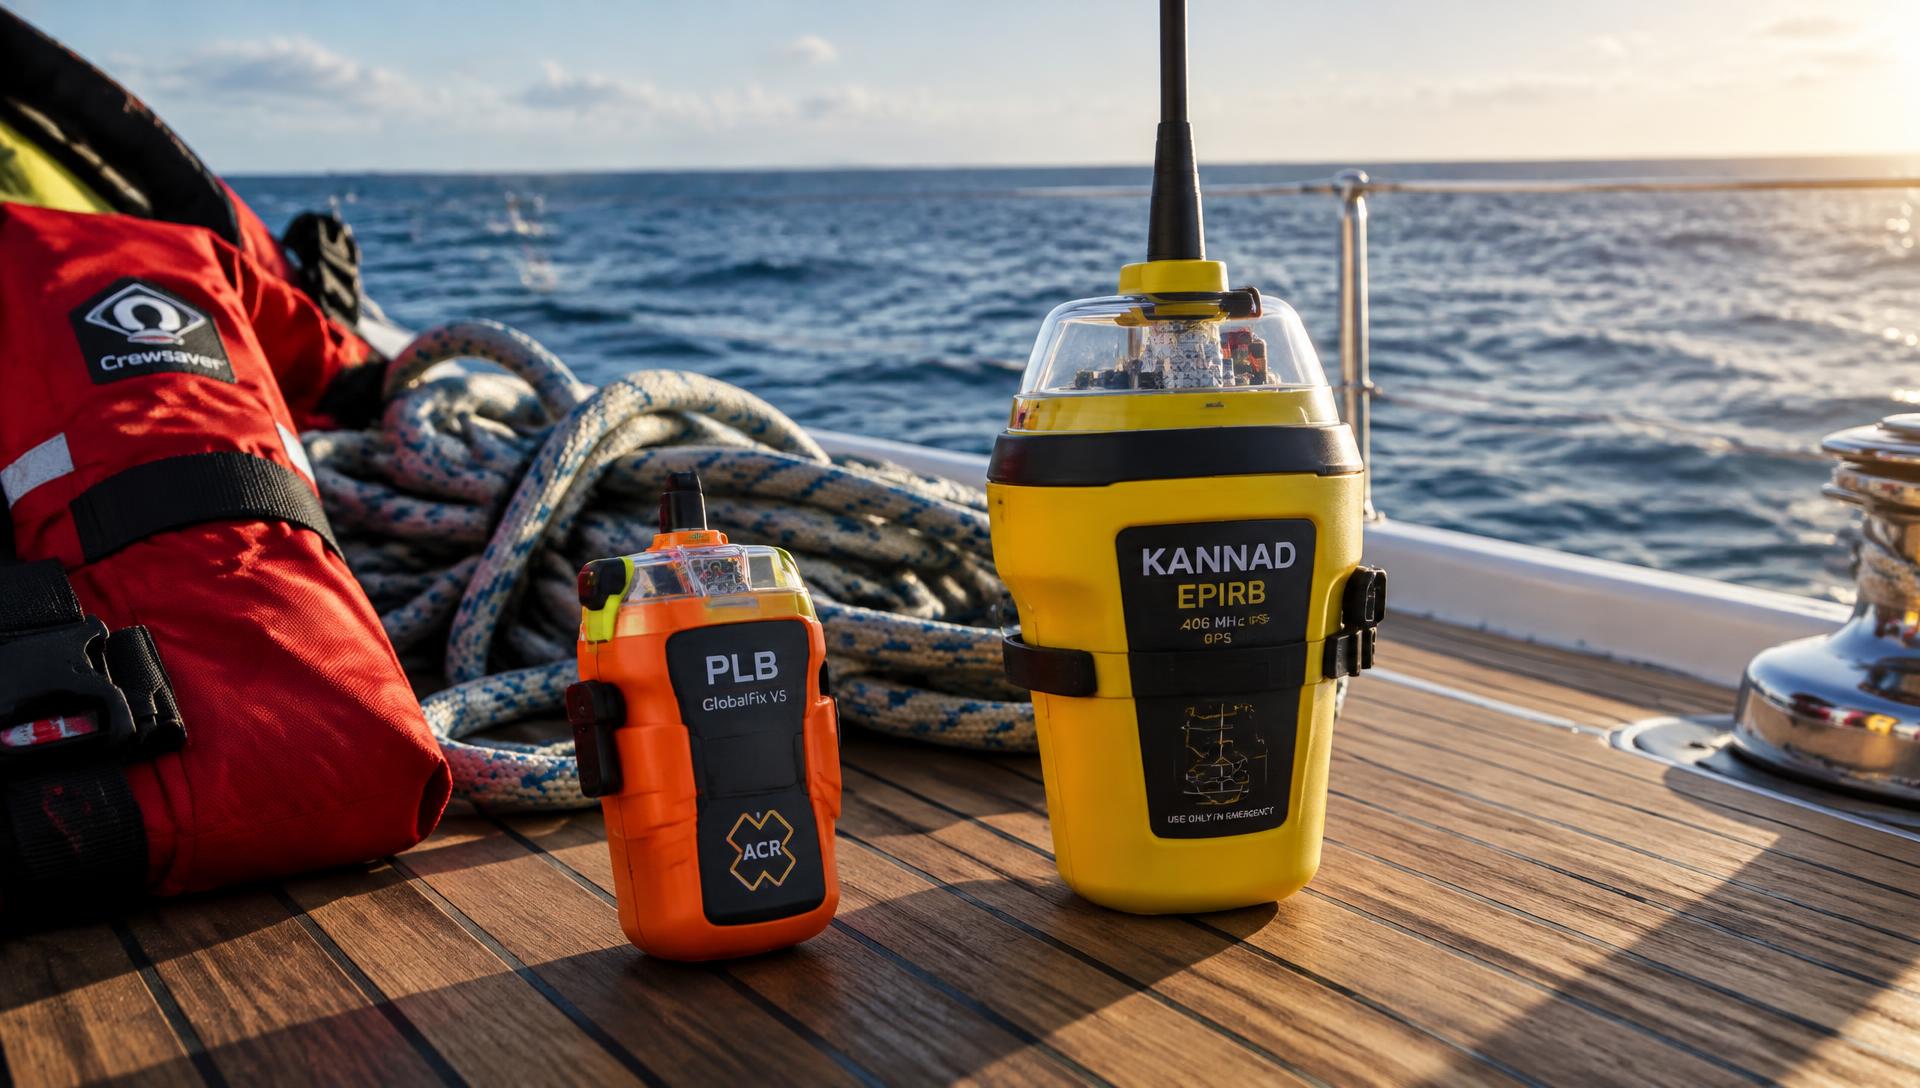
Life-Saving Equipment Offshore: PLBs, EPIRBs, SARTs and Satellite Communicators
Four technologies that decide how quickly rescuers find you — PLBs, EPIRBs, SARTs and satellite communicators — and why a well-equipped offshore yacht carries several of them.
Captain's Corner Magazine · 17 October 2026
 Knowledge
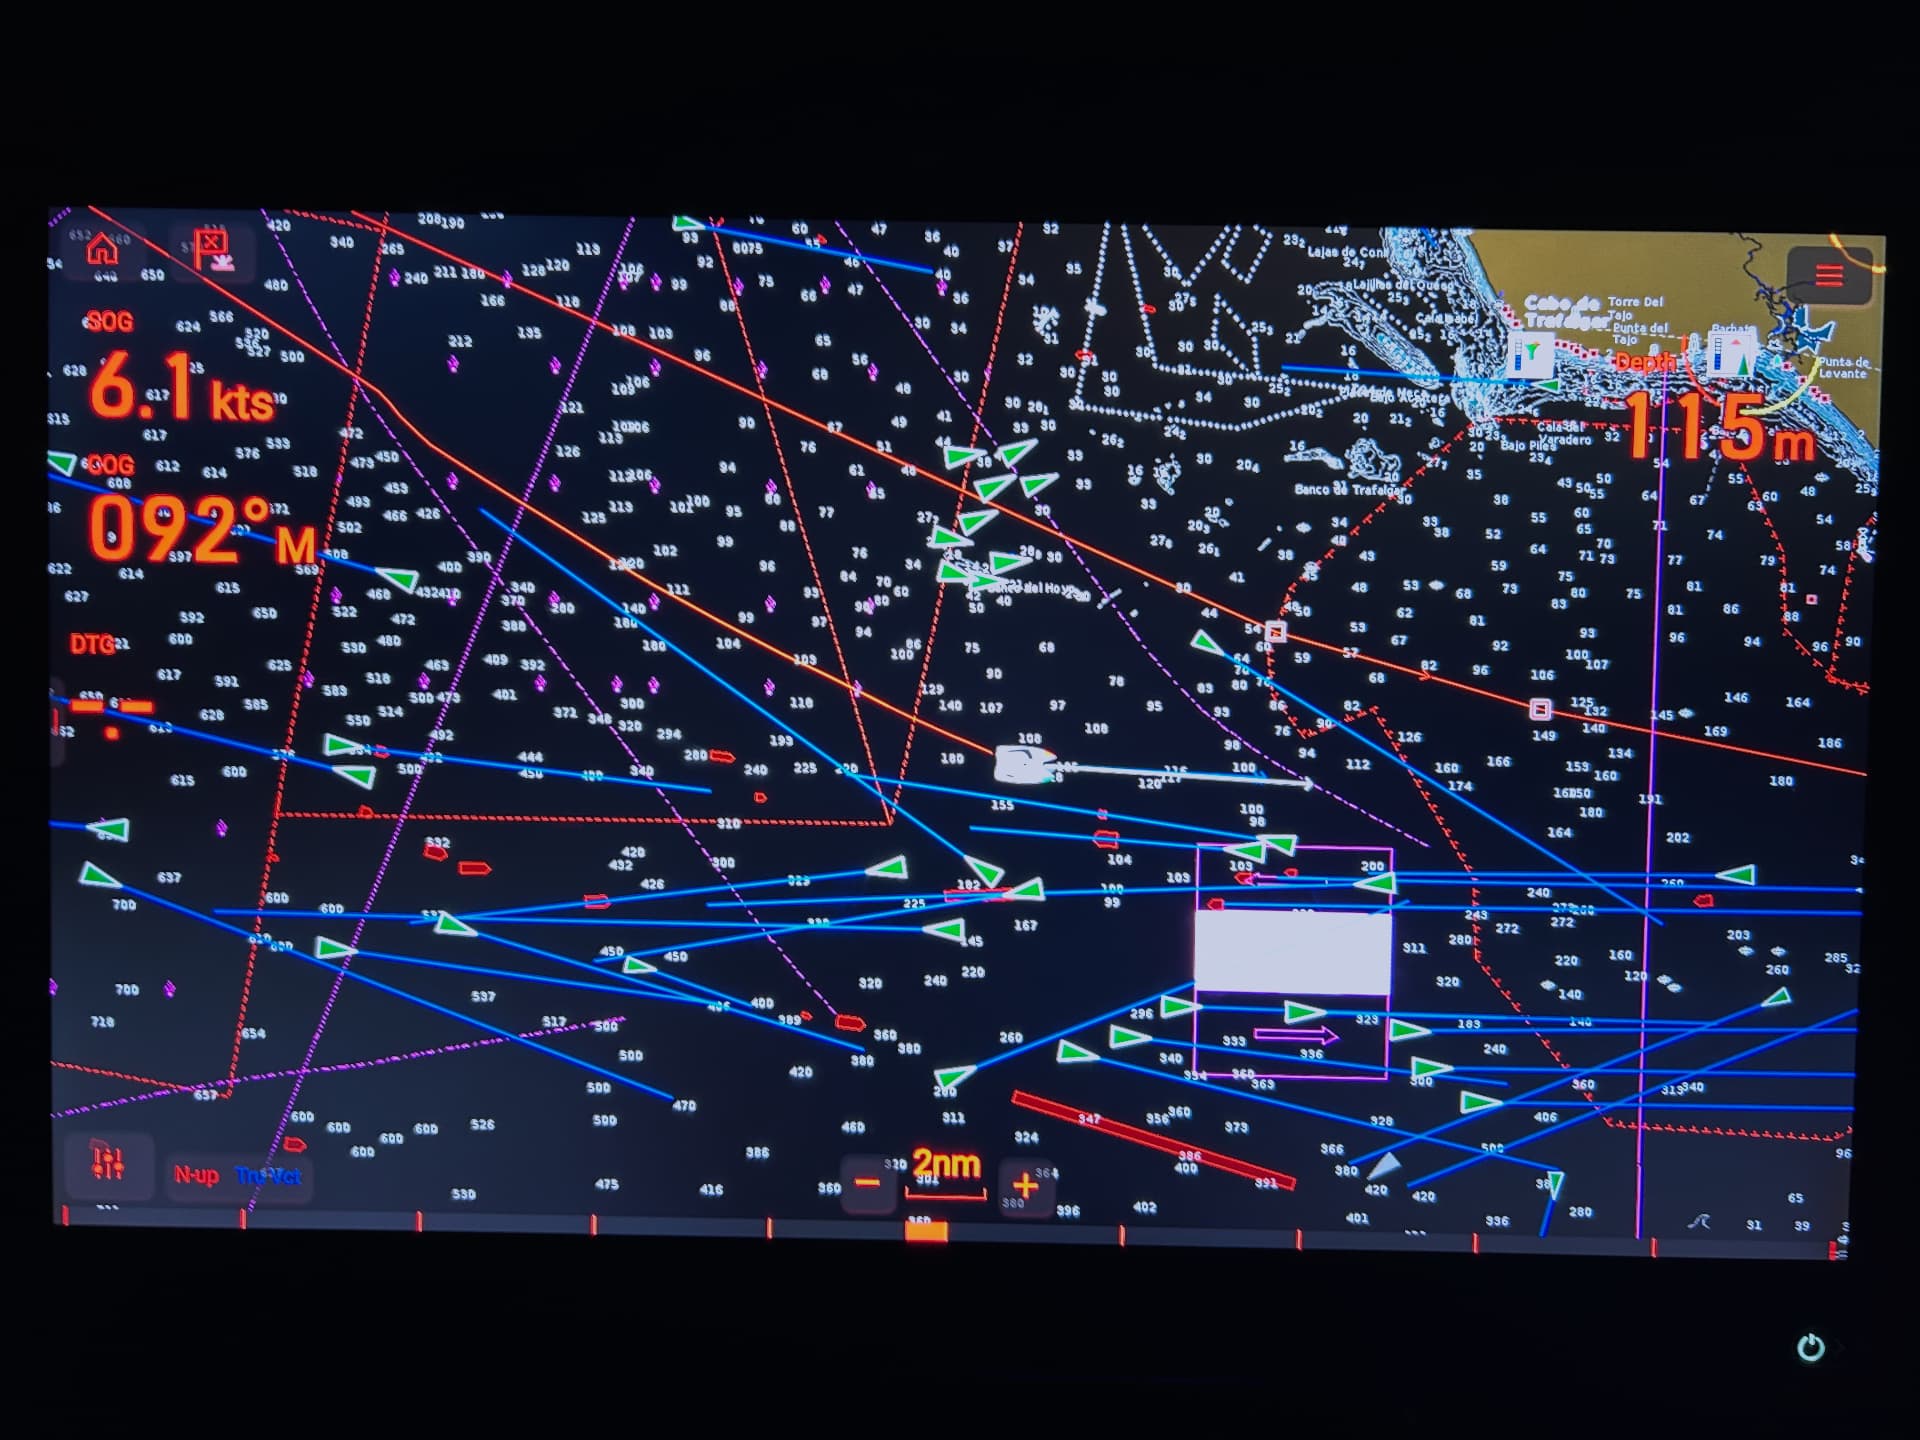
GPS vs DGPS – What Is the Difference?
How differential corrections improve satellite positioning, and why greater accuracy matters in marine navigation.
Captain's Corner Magazine · 15 August 2026
 Knowledge
From the Ocean to the Human Body: The Growing Impact of Plastic Pollution
A plastic bottle thrown overboard does not disappear — it fragments into microplastics that travel from the sea into soil, crops, drinking water and, ultimately, the human body.
Captain's Corner Magazine · 17 October 2026